How to migrate Clipfolio dashboards to Looker Studio (nonprofit playbook)
Planning a Clipfolio to Looker Studio migration? Use this nonprofit playbook to inventory clips, rebuild data sources, validate metrics, and deploy to TVs.
If you’re currently running dashboards in Clipfolio and want a more scalable, lower-cost setup, migrating to Google Looker Studio is a practical upgrade—especially for nonprofits already on Google Workspace. The fastest path is to inventory your existing dashboards and “clips,” recreate each chart/report in Looker Studio, standardize your data sources + governance, and then redeploy the finished dashboards to your TV/signage devices.
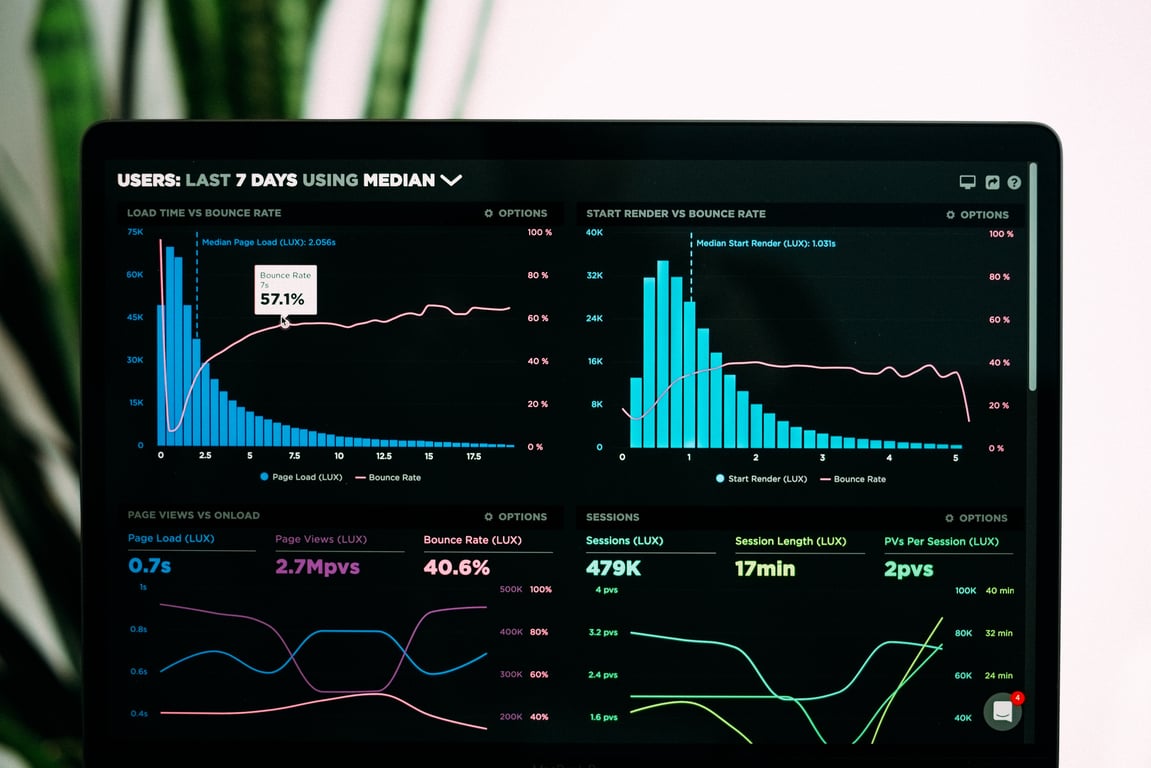
Photo by Luke Chesser on Unsplash
Why migrate from Clipfolio to Looker Studio?
Clipfolio can work well for quick dashboarding, but teams often outgrow it when they need:
Easier collaboration + sharing
Lower ongoing costs (Looker Studio is included with Google Workspace)
Cleaner governance (permissions, ownership, standardized data sources)
More flexibility as dashboards multiply across teams and locations (e.g., TV signage)
Before you start: define “success” for the new dashboards
Before rebuilding anything, write down:
Who each dashboard is for (exec team, ops, development, finance, program leads)
Where it will be viewed (desktop, wall TV, signage stick, mobile)
The refresh requirements (near real-time vs daily/weekly)
The single source of truth for each metric (finance, CRM, case management, spreadsheets, etc.)
Step 1: Inventory your Clipfolio dashboards (and clips)
Create a simple inventory so the migration doesn’t turn into guesswork.
Dashboard inventory checklist
For each Clipfolio dashboard, capture:
Dashboard name
Intended audience
Where it’s displayed (including which TVs / signage devices)
A screenshot of the full dashboard
Any filters or date ranges users rely on
Clip / visualization inventory checklist
For each Clipfolio clip (chart/table/KPI), capture:
Clip name + screenshot
Metric definition (what exactly is being measured)
Data source (app + account + table/report)
Refresh cadence
Filters/segments (by location, program, date range, etc.)
Known “gotchas” (manual cleanup, weird joins, missing fields)
Tip: If you have a lot of clips, start with the dashboards that matter most day-to-day, then migrate the rest in waves.
Step 2: Map each Clipfolio clip to a Looker Studio equivalent
Most Clipfolio visuals map cleanly to Looker Studio components:
Scorecards → Scorecards
Time series charts → Time series
Bar/column charts → Bar/column
Tables → Tables with conditional formatting
Multi-metric views → Blended data (when needed) or a modeled source upstream
Watch-outs during mapping
If a clip depends on heavy transformation, it’s usually better to fix that upstream (in the data source or a connector layer) than to hack it inside Looker Studio.
If you’re using multiple apps, plan for connector limitations and potential cost (some connectors are paid).
Step 3: Rebuild data sources (and choose connector tooling)
Looker Studio can connect to many sources directly, but teams often need connector apps for:
Accounting systems (e.g., QuickBooks)
CRMs and case management tools
Custom APIs
Non-standard databases
Data-source setup checklist
Decide which account “owns” each connection (so it’s not tied to a single person’s login)
Confirm refresh settings and data latency expectations
Governance decision: one shared data source vs per-dashboard sources
In most cases, you’ll want:
Shared, reusable data sources for common metrics
Clear ownership (who maintains each source)
A “change management” approach so metric definitions don’t drift
Step 4: Recreate charts, filters, and layouts in Looker Studio
Rebuild each dashboard in Looker Studio using your inventory as the blueprint.
Rebuild workflow (repeatable playbook)
Create the report shell (layout, header, spacing, color palette)
Add the base data source(s)
Recreate the highest-value visuals first (the charts people actually use)
Add filters + date controls
Validate each metric against the old dashboard
Document “what changed” (if anything) and why
Validation checklist (per chart)
Numbers match Clipfolio within an acceptable tolerance
Filters behave correctly
Date ranges and time zones are correct
Any “rollups” (weekly/monthly) match expectations
Performance is acceptable (dashboard loads quickly)
Step 5: Permissions, ownership, and long-term maintenance
This is the step that makes the migration stick.
Recommended governance setup
Use shared ownership where possible (not an individual account)
Create a simple rule set for:
Who can edit reports
Who can edit data sources
Who can share to new viewers
Document naming conventions and folder structure
Keep an “audit checklist” for quarterly review (broken connectors, stale dashboards, permission drift)
Step 6: Deploy to TV signage / wall dashboards
If you’re displaying dashboards on TVs via signage sticks:
Confirm the report is readable at a distance (bigger text, fewer elements per slide)
Use full-screen mode and test auto-refresh behavior
Standardize the deployment method per location (so it’s not a one-off setup per TV)
TV dashboard design tips
Prioritize 5–9 metrics per screen
Use clear labels (no acronyms unless everyone knows them)
Avoid dense tables unless they’re truly necessary
Add a “last updated” timestamp somewhere visible
Migration timeline (example)
A practical approach for multiple dashboards:
Week 1: Inventory + data-source decisions
Week 2: Rebuild core dashboards (the ones used daily)
Week 3: Rebuild secondary dashboards + TV deployment polish
Week 4: Cleanup, documentation, and handoff/training
Common pitfalls (and how to avoid them)
Rebuilding dashboards before clarifying metric definitions → define metrics first
Connectors owned by one person → use shared ownership/credentials
Dashboard sprawl → use a standard template + naming conventions
Overcomplicating in Looker Studio → do transformations upstream when possible
Get help migrating your Clipfolio dashboards
If you want a consultant to help you migrate your Clipfolio dashboards into Looker Studio—while also setting up governance and a repeatable playbook—book a call here: https://connex.digital/book/website
Supabase vs BigQuery for large datasets: Supabase wins for day-to-day ops (auth, RLS, CRUD). BigQuery wins for analytics at scale. See how agencies choose.
Your monday.com Make API migration checklist: inventory affected scenarios, run a pilot, bulk-update with find/replace, and roll back if anything breaks.


 Made with Bullet